Market Outlook
October 10, 2016
Market Cues
Domestic Indices
Chg (%)
(Pts)
(Close)
Indian markets are likely to open flat tracking global markets and SGX NIFTY.
BSE Sensex
(0.2)
(45)
28,061
Nifty
(0.1)
(12)
8,698
After coming under pressure over the course of morning trading on Friday, stocks
Mid Cap
0.0
2
13,543
regained some ground in the afternoon but still closed modestly lower. The major
Small Cap
(0.0)
(3)
13,222
averages ended the day in negative territory but well off their worst levels.
Bankex
(0.0)
(6)
22,153
The European markets closed on mixed note. While CAC & DAX ended lower the UK
market closed higher, as a drop in British pound buoyed the outlook for companies
Global Indices
Chg (%)
(Pts)
(Close)
in overseas earnings.
Dow Jones
(0.2)
(28)
18,240
Indian markets remained lackluster on Friday, as global markets also remained in
Nasdaq
(0.3)
(14)
5,292
narrow range. Further lower trading sessions in the coming week, together with
upcoming results session seems to have played a key role in lower participation by
FTSE
0.6
44
7,044
investors and traders.
Nikkei
(0.2)
(39)
16,860
Hang Seng
(0.4)
(101)
23,852
News Analysis
Shanghai Com
0.2
6
3,005
Supreme Court stays Patna High Court order quashing Bihar liquor ban law
Detailed analysis on Pg2
Advances / Declines
BSE
NSE
Investor’s Ready Reckoner
Advances
1,384
773
Declines
1,415
837
Key Domestic & Global Indicators
Unchanged
216
37
Stock Watch: Latest investment recommendations on 150+ stocks
Refer Pg5 onwards
Volumes (` Cr)
Top Picks
BSE
3,337
CMP
Target
Upside
Company
Sector
Rating
(`)
(`)
(%)
NSE
19,344
Amara Raja Batteries Auto & Auto Ancill. Accumulate
1,048
1,174
12.1
HCL Tech
IT
Buy
806
1,000
24.1
Net Inflows (` Cr)
Net
Mtd
Ytd
Bharat Electronics
Capital Goods
Accumulate
1,268
1,414
11.5
FII
56
1,324
51,273
Equitas Holdings
Financials
Buy
180
235
30.4
Navkar Corporation Others
Buy
196
265
35.4
MFs
726
1,329
14,550
More Top Picks on Pg3
Top Gainers
Price (`)
Chg (%)
Key Upcoming Events
Previous
Consensus
Suntv
562
7.3
Date
Region
Event Description
Reading
Expectations
Balramchin
118
6.8
Oct 10 US
Unemployment rate
4.9
4.9
Gsfc
92
5.6
Oct 13 India
Imports YoY%
(14.1)
--
Oct 13 India
Exports YoY%
(0.3)
--
Mrpl
93
4.8
Oct 13 China
Exports YoY%
(2.8)
(3.3)
Coromandel
270
4.8
Oct 13 US
Initial Jobless claims
249.0
--
Oct 14 US
Producer Price Index (MoM)
(0.3)
--
Top Losers
Price (`)
Chg (%)
Oct 14 India
Monthly Wholesale Prices YoY%
3.7
3.9
6.(
Naukri
934
(5.9)
More Events on Pg4
Marksans
54
(3.2)
Southbank
24
(3.2)
Infratel
370
(3.0)
Niittech
408
(2.9)
As on October 07, 2016
Market Outlook
October 10, 2016
News Analysis
Supreme Court stays Patna High Court order quashing Bihar
liquor ban law
Bihar government restricted the manufacture, transport, sale and consumption of
liquor, effective from 1st April in the state. On the petitions filed by the Liquor Trade
Association and others, the high court passed an order on 30th September
nullifying the ban imposed. Further, Bihar government approached the apex court
and urged to decide whether state can impose absolute prohibition on distribution
and consumption of liquor. The Supreme Court on Friday stayed the operation of
the Patna High Court judgment. Considering the recent news and as our target
price for Radico Khaitan has been achieved in recent past, we are neutral on the
stock.
Economic and Political News
Passenger Vehicle sales in September grew by 20%, while two wheeler sales
grew by 21%
States to get loans for rural electrification
Singapore wants to delay revision tax treaty with India
FM Arun Jaitley warns against risk of low, negative interest rates
Govt extends anti dumping duty on certain Chinese products
Corporate News
JLR sales grew 28% in September to 61,047 units.
Recoveries to be higher in Q2 vs Q1 says PNB
Quarterly Bloomberg Brokers Consensus Estimate
Tata Consultancy Services Ltd Consol - October 13, 2016
Particulars ( ` cr)
2QFY17E
2QFY16
y-o-y (%)
1QFY17
q-o-q (%)
Net sales
29,279
27,165
7.8
29,305
(0.1)
EBITDA
7,717
7,822
(1.4)
7,838
(1.6)
EBITDA margin (%)
26.4
28.8
26.7
Net profit
6,056
6,085
(0.5)
6,317
(4.1)
Infosys Ltd Consol - October 14, 2016
Particulars ( ` cr)
2QFY17E
2QFY16
y-o-y (%)
1QFY17
q-o-q (%)
Net sales
17,049
15,635
9.0
16,782
1.6
EBITDA
4,457
4,351
2.4
4,447
0.2
EBITDA margin (%)
26.1
27.8
26.5
Net profit
3,429
3,398
0.9
3,436
(0.2)
Market Outlook
October 10, 2016
Top Picks ★★★★★
Large Cap
Market Cap
CMP
Target
Upside
Company
Rationale
(` Cr)
(`)
(`)
(%)
To outpace battery industry growth due to better technological
Amara Raja Batteries
17,896
1,048
1,174
12.1
products leading to market share gains in both the
automotive OEM and replacement segments.
Uptick in defense capex by government when coupled with
Bharat Electronics
30,422
1,268
1,414
11.5
BELs strong market positioning, indicate that good times are
ahead for BEL.
The stock is trading at attractive valuations and is factoring all
HCL Tech
1,13,679
806
1,000
24.1
the bad news.
Back on the growth trend, expect a long term growth of 14%
Infosys
2,32,600
1,013
1,370
35.3
to be a US$20bn in FY2020.
Source: Company, Angel Research
Mid Cap
Market Cap
CMP
Target
Upside
Company
Rationale
(` Cr)
(`)
(`)
(%)
Among the top 4 players in the consumer durables segment.
Bajaj Electricals
2,655
263
306
16.5
Improved profitability backed by turn around in E&P
segment. Strong order book lends earnings visibility.
With a focus on the low and medium income (LMI) consumer
Dewan Housing Finance
8,532
292
325
11.1
segment, the company has increased its presence in tier-II &
III cities where the growth opportunity is immense.
Strong loan growth backed by diversified loan portfolio and
adequate CAR. ROE & ROA likely to remain decent as risk of
Equitas Holdings
6,045
180
235
30.4
dilution remains low. Attractive valuations considering
growth.
Economic recovery to have favourable impact on advertising
& circulation revenue growth. Further, the acquisition of a
Jagran Prakashan
6,582
201
225
11.7
radio business (Radio City) would also boost the company's
revenue growth.
Speedier execution and speedier sales, strong revenue
Mahindra Lifespace
1,812
442
522
18.2
visibilty in short-to-long run, attractive valuations
Massive capacity expansion along with rail advantage at ICD
Navkar Corporation
2,790
196
265
35.4
as well CFS augurs well for the company
Market leadership in Hindi news genre and no. 2 viewership
ranking in English news genre, exit from the radio business,
TV Today Network
2,015
338
363
7.4
and anticipated growth in ad spends by corporates to benefit
the stock.
Source: Company, Angel Research
Market Outlook
October 10, 2016
Key Upcoming Events
Global economic events release calendar
Bloomberg Data
Date
Time
Country
Event Description
Unit
Period
Last Reported
Estimated
Oct 10, 2016
6:00 PM
US Unemployment rate
%
Sep
4.90
4.90
Oct 13, 2016
6:00 PM
US Initial Jobless claims
Thousands
Oct 8
249.00
China Exports YoY%
% Change
Sep
(2.80)
(3.30)
India Imports YoY%
% Change
Sep
(14.09)
India Exports YoY%
% Change
Sep
(0.30)
Oct 14, 2016
US Producer Price Index (mom)
% Change
Sep
(0.30)
12:00 PM India Monthly Wholesale Prices YoY%
% Change
Sep
3.74
3.85
7:00 AM China Consumer Price Index (YoY)
% Change
Sep
1.30
1.60
Oct 17, 2016
2:30 PM Euro Zone Euro-Zone CPI (YoY)
%
Sep F
0.40
6:45 PM
US Industrial Production
%
Sep
(0.43)
0.10
Oct 18, 2016
6:00 PM
US Consumer price index (mom)
% Change
Sep
0.20
0.30
2:00 PM
UK CPI (YoY)
% Change
Sep
0.60
Oct 19, 2016
6:00 PM
US Housing Starts
Thousands
Sep
1,142.00
1,170.00
6:00 PM
US Building permits
Thousands
Sep
1,152.00
1,163.00
7:30 AM China Industrial Production (YoY)
% Change
Sep
6.30
6.40
2:00 PM
UK Jobless claims change
% Change
Sep
2.40
7:30 AM China Real GDP (YoY)
% Change
3Q
6.70
6.70
Oct 20, 2016
7:30 PM
US Existing home sales
Million
Sep
5.33
5.40
5:15 PM Euro Zone ECB announces interest rates
%
Oct 20
-
Oct 21, 2016
7:30 PM Euro Zone Euro-Zone Consumer Confidence
Value
Oct A
(8.20)
Oct 24, 2016
1:00 PM Germany PMI Services
Value
Oct P
50.90
1:00 PM Germany PMI Manufacturing
Value
Oct P
54.30
Oct 25, 2016
7:30 PM
US Consumer Confidence
S.A./ 1985=100 Oct
104.10
Oct 26, 2016
7:30 PM
US New home sales
Thousands
Sep
609.00
Source: Bloomberg, Angel Research
Market Outlook
October 10, 2016
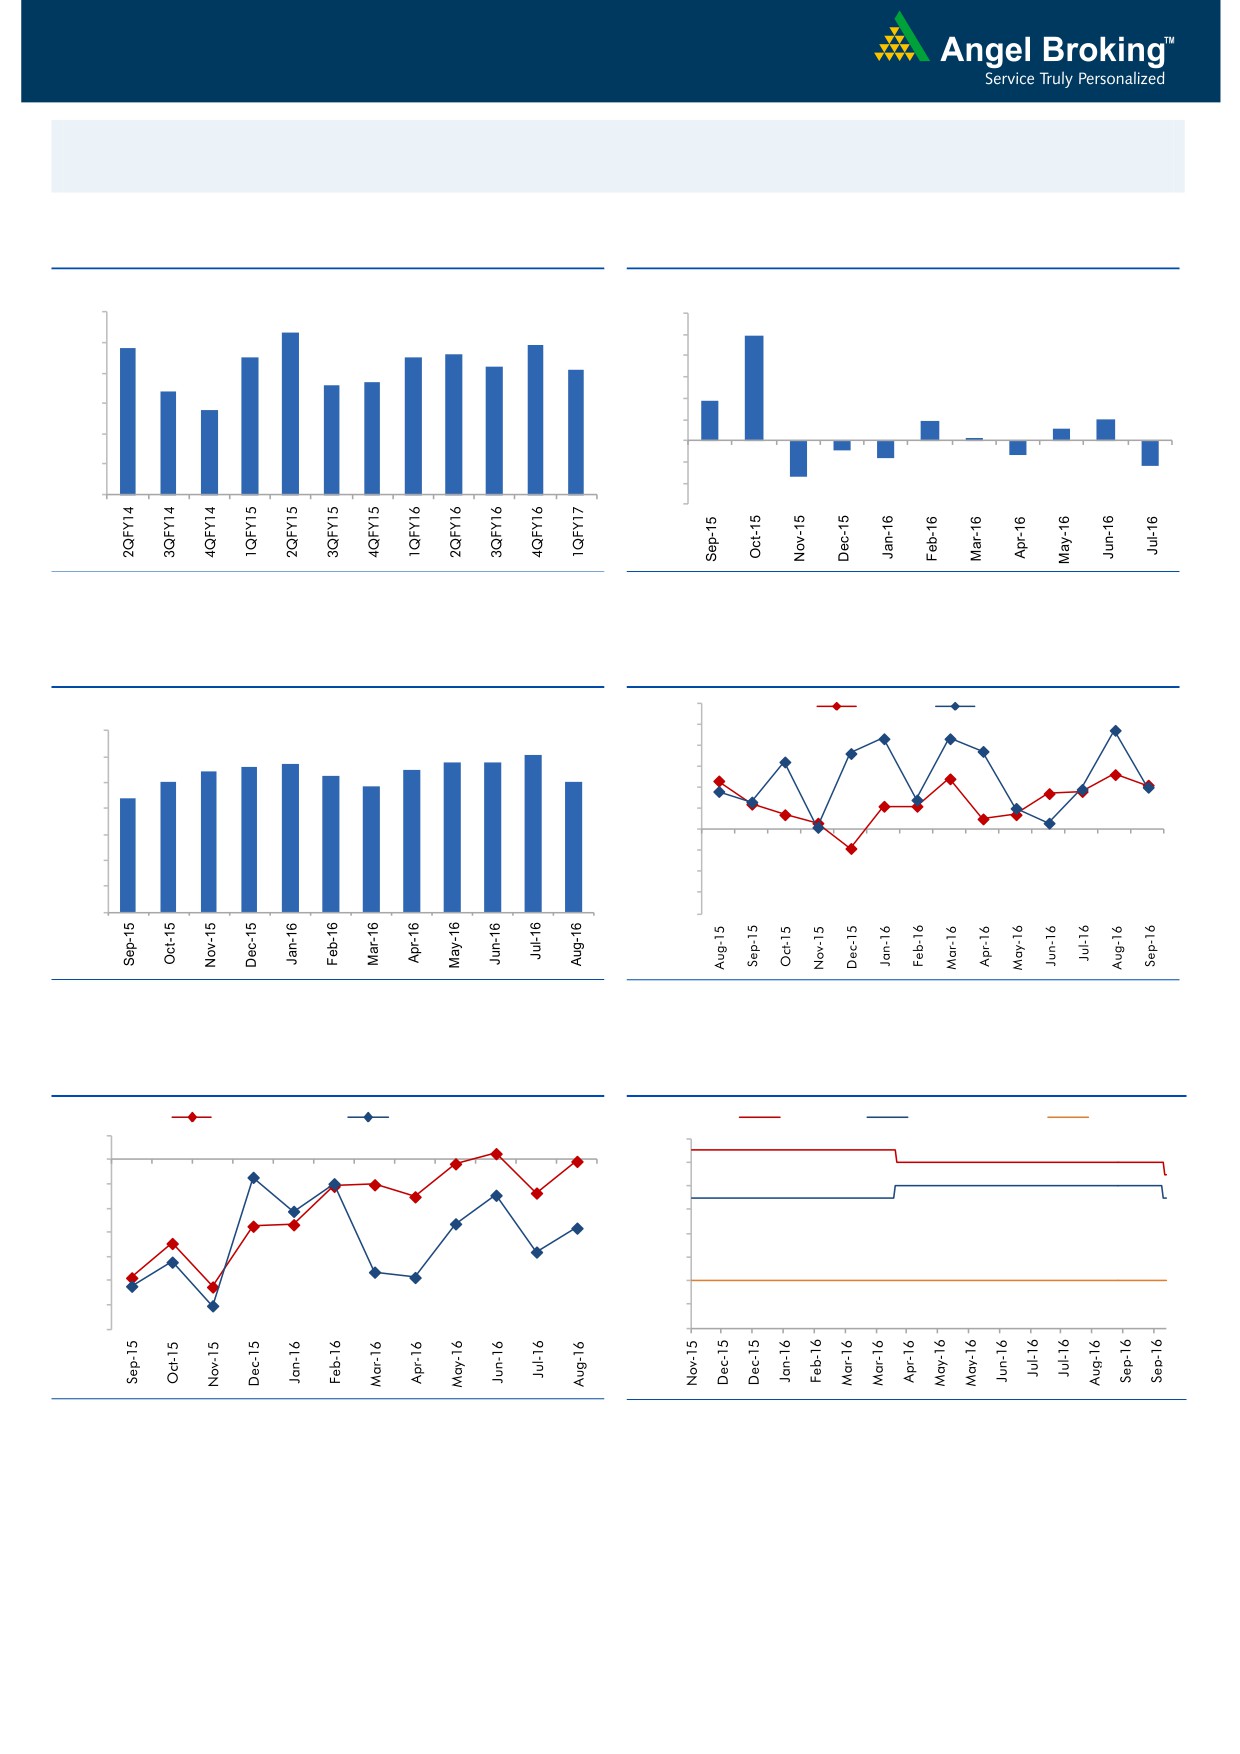
Macro watch
Exhibit 1: Quarterly GDP trends
Exhibit 2: IIP trends
(%)
(%)
9.0
12.0
8.3
9.9
7.8
7.9
8.0
7.5
7.5
7.6
10.0
7.2
7.1
8.0
6.6
6.7
7.0
6.4
6.0
3.7
5.8
6.0
4.0
1.9
2.0
1.1
2.0
0.3
5.0
-
4.0
(2.0)
(0.9)
(1.3)
(1.6)
(4.0)
(2.4)
3.0
(3.4)
(6.0)
Source: CSO, Angel Research
Source: MOSPI, Angel Research
Exhibit 3: Monthly CPI inflation trends
Exhibit 4: Manufacturing and services PMI
56.0
Mfg. PMI
Services PMI
(%)
55.0
7.0
6.1
5.7
5.8
5.8
54.0
6.0
5.4
5.6
5.5
5.0
5.3
5.1
53.0
4.8
5.0
4.4
52.0
4.0
51.0
50.0
3.0
49.0
2.0
48.0
1.0
47.0
-
46.0
Source: MOSPI, Angel Research
Source: Market, Angel Research; Note: Level above 50 indicates expansion
Exhibit 5: Exports and imports growth trends
Exhibit 6: Key policy rates
(%)
Exports yoy growth
Imports yoy growth
(%)
Repo rate
Reverse Repo rate
CRR
5.0
7.00
0.0
6.50
(5.0)
6.00
(10.0)
5.50
(15.0)
5.00
(20.0)
4.50
(25.0)
4.00
(30.0)
3.50
(35.0)
3.00
Source: Bloomberg, Angel Research
Source: RBI, Angel Research
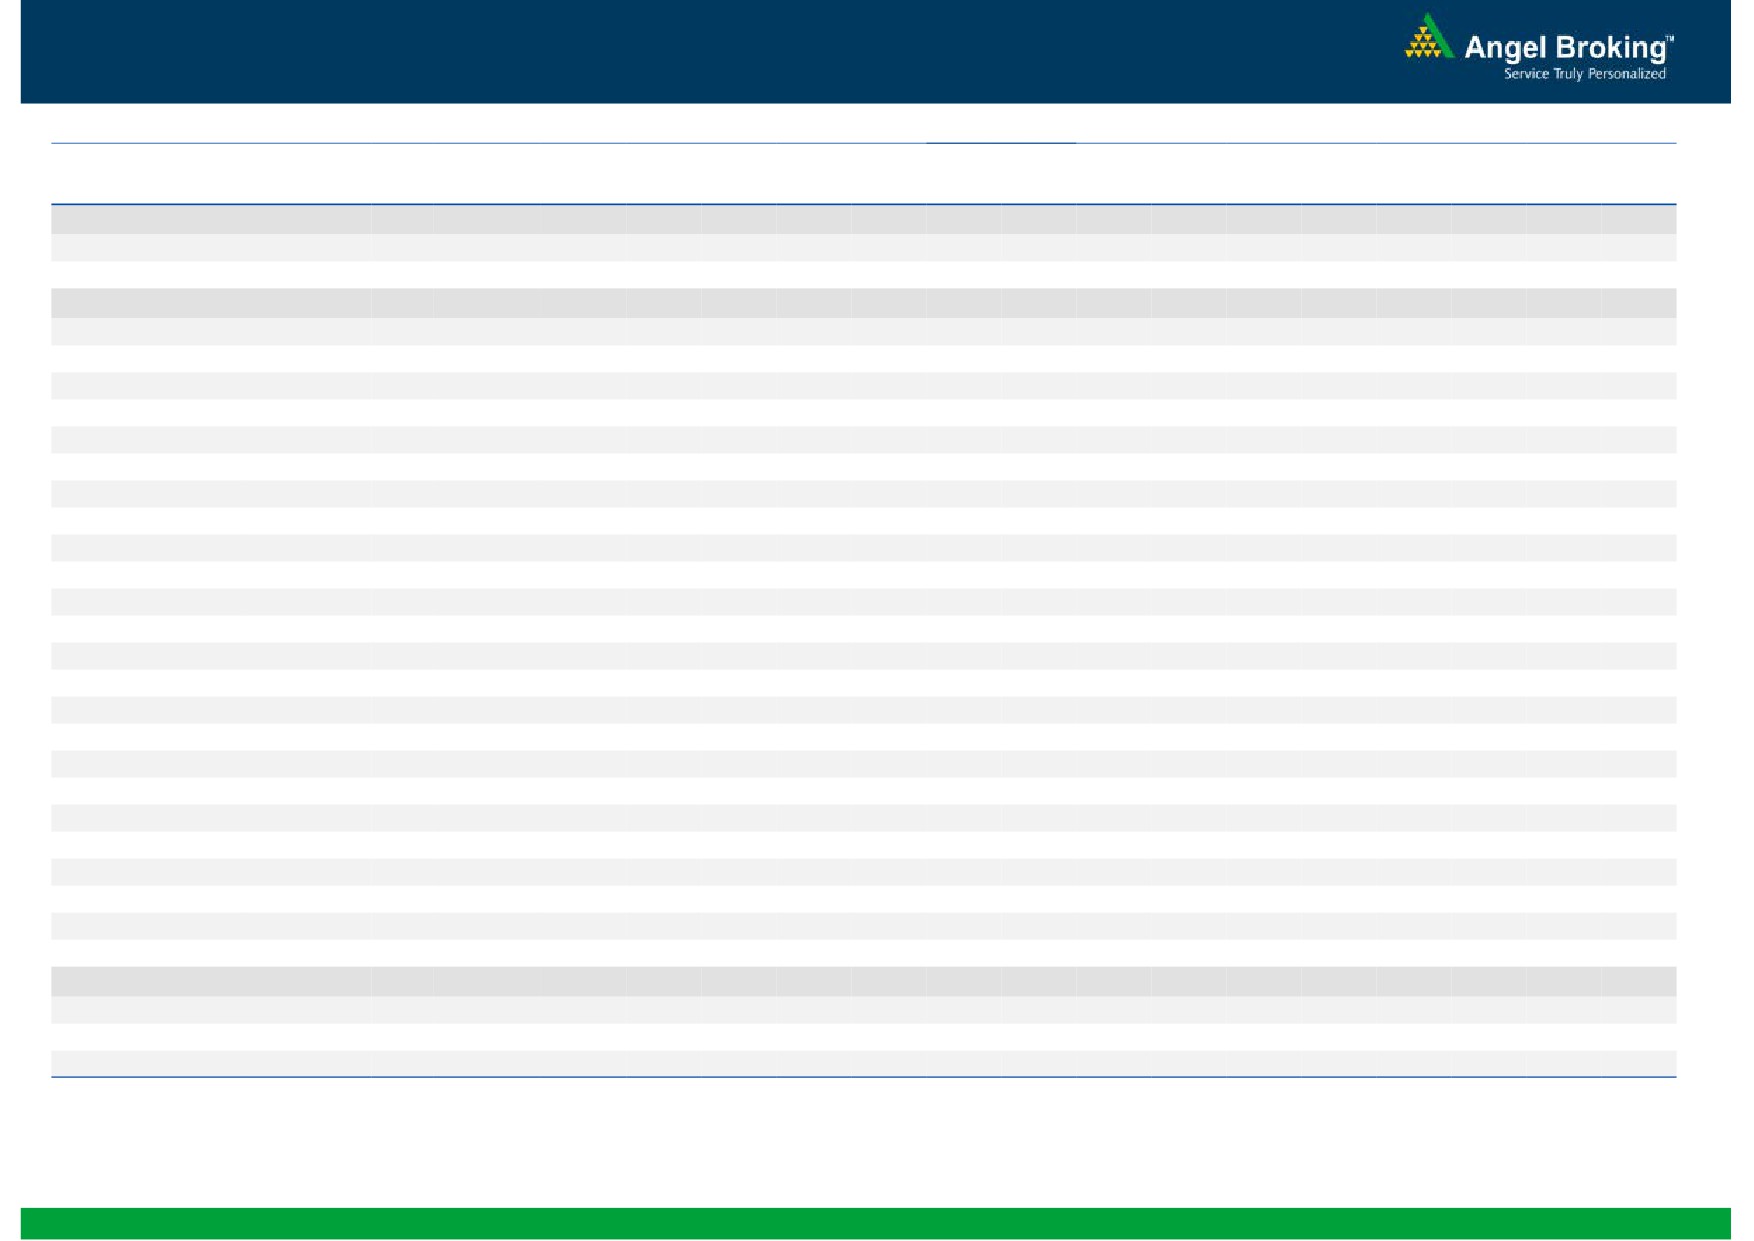
Stock Watch
October 10, 2016
Company Name
Reco
CMP
Target
Mkt Cap
Sales ( Čcr )
OPM(%)
EPS (Č)
PER(x)
P/BV(x)
RoE(%)
EV/Sales(x)
(Č)
Price ( Č)
( Č cr )
FY17E FY18E
FY17E
FY18E
FY17E
FY18E
FY17E
FY18E
FY17E
FY18E
FY17E
FY18E
FY17E
FY18E
Agri / Agri Chemical
Rallis
Neutral
233
-
4,523
1,937
2,164
13.3
14.3
9.0
11.0
25.8
21.2
4.5
3.9
18.4
19.8
2.4
2.1
United Phosphorus
Neutral
671
-
34,024
15,176
17,604
18.5
18.5
37.4
44.6
18.0
15.1
3.5
2.9
21.4
21.2
2.4
2.0
Auto & Auto Ancillary
Ashok Leyland
Buy
81
111
23,123
22,407
26,022
10.6
10.6
5.2
6.4
15.6
12.7
3.5
3.0
23.6
24.7
1.1
0.9
Bajaj Auto
Neutral
2,884
-
83,451
25,093
27,891
19.5
19.2
143.9
162.5
20.0
17.8
5.6
4.8
30.3
29.4
3.1
2.7
Bharat Forge
Neutral
957
-
22,268
7,726
8,713
20.5
21.2
35.3
42.7
27.1
22.4
5.0
4.5
18.9
20.1
2.9
2.6
Eicher Motors
Neutral
25,810
-
70,104
16,583
20,447
17.5
18.0
598.0
745.2
43.2
34.6
14.8
11.2
41.2
38.3
4.1
3.2
Gabriel India
Neutral
118
-
1,693
1,544
1,715
9.0
9.3
5.4
6.3
21.8
18.7
4.1
3.7
18.9
19.5
1.1
0.9
Hero Motocorp
Neutral
3,472
-
69,326
31,253
35,198
15.3
15.0
172.3
192.1
20.2
18.1
7.4
6.3
38.9
37.0
2.1
1.8
Jamna Auto Industries Neutral
218
-
1,740
1,486
1,620
9.8
9.9
15.0
17.2
14.5
12.7
3.2
2.7
21.8
21.3
1.2
1.1
L G Balakrishnan & Bros Neutral
613
-
962
1,302
1,432
11.6
11.9
43.7
53.0
14.0
11.6
2.0
1.8
13.8
14.2
0.8
0.8
Mahindra and Mahindra Neutral
1,374
-
85,329
46,534
53,077
11.6
11.7
67.3
78.1
20.4
17.6
3.3
2.9
15.4
15.8
1.8
1.6
Maruti
Neutral
5,682
-
171,656
69,186
82,217
14.7
14.4
198.5
241.4
28.6
23.5
5.6
4.5
20.2
20.0
2.2
1.8
Minda Industries
Neutral
325
-
2,576
2,728
3,042
9.0
9.1
68.2
86.2
4.8
3.8
1.1
0.9
23.8
24.3
1.0
0.9
Motherson Sumi
Neutral
329
-
46,193
45,896
53,687
7.8
8.3
13.0
16.1
25.2
20.4
8.1
6.5
34.7
35.4
1.1
0.9
Rane Brake Lining
Neutral
1,251
-
990
511
562
11.3
11.5
28.1
30.9
44.5
40.5
6.8
6.2
15.3
15.0
2.1
1.9
Setco Automotive
Neutral
43
-
576
741
837
13.0
13.0
15.2
17.0
2.8
2.5
0.5
0.4
15.8
16.3
1.2
1.1
Tata Motors
Neutral
566
-
163,329
300,209
338,549
8.9
8.4
42.7
54.3
13.3
10.4
2.1
1.8
15.6
17.2
0.7
0.6
TVS Motor
Neutral
386
-
18,343
13,390
15,948
6.9
7.1
12.8
16.5
30.3
23.3
7.5
6.0
26.3
27.2
1.4
1.2
Amara Raja Batteries
Accumulate
1,048
1,174
17,896
5,429
6,471
17.5
17.6
35.3
43.5
29.7
24.1
6.8
5.5
25.3
24.8
3.2
2.6
Exide Industries
Neutral
193
-
16,443
7,439
8,307
15.0
15.0
8.1
9.3
23.9
20.8
3.3
3.0
14.3
16.7
1.8
1.6
Apollo Tyres
Neutral
224
-
11,379
12,877
14,504
14.3
13.9
21.4
23.0
10.4
9.7
1.6
1.4
16.4
15.2
1.1
1.0
Ceat
Neutral
1,373
-
5,552
7,524
8,624
13.0
12.7
131.1
144.3
10.5
9.5
1.9
1.6
19.8
18.6
0.8
0.7
JK Tyres
Neutral
153
-
3,461
7,455
8,056
15.0
15.0
21.8
24.5
7.0
6.2
1.5
1.2
22.8
21.3
0.6
0.5
Swaraj Engines
Neutral
1,331
-
1,654
660
810
15.2
16.4
54.5
72.8
24.4
18.3
7.6
6.9
31.5
39.2
2.3
1.9
Subros
Neutral
137
-
820
1,488
1,681
11.7
11.9
6.4
7.2
21.4
19.1
2.3
2.1
10.8
11.4
0.8
0.7
Indag Rubber
Neutral
219
-
575
286
326
19.8
16.8
11.7
13.3
18.7
16.4
3.2
3.0
17.8
17.1
1.7
1.5
Capital Goods
ACE
Neutral
44
-
436
709
814
4.1
4.6
1.4
2.1
31.5
21.0
1.3
1.2
4.4
6.0
0.8
0.7
BEML
Buy
907
1,157
3,776
3,451
4,055
6.3
9.2
31.4
57.9
28.9
15.7
1.7
1.6
6.3
10.9
1.2
1.0
Bharat Electronics
Accumulate
1,268
1,414
30,422
8,137
9,169
16.8
17.2
58.7
62.5
21.6
20.3
3.3
3.0
44.6
46.3
2.7
2.4
Stock Watch
October 10, 2016
Company Name
Reco
CMP
Target
Mkt Cap
Sales ( Čcr )
OPM(%)
EPS (Č)
PER(x)
P/BV(x)
RoE(%)
EV/Sales(x)
(Č)
Price ( Č)
( Č cr )
FY17E
FY18E
FY17E
FY18E
FY17E
FY18E
FY17E
FY18E
FY17E
FY18E
FY17E
FY18E
FY17E
FY18E
Capital Goods
Voltas
Neutral
388
-
12,842
6,511
7,514
7.9
8.7
12.9
16.3
30.1
23.8
5.4
4.7
16.7
18.5
1.7
1.5
BGR Energy
Neutral
117
-
846
16,567
33,848
6.0
5.6
7.8
5.9
15.0
19.9
0.9
0.8
4.7
4.2
0.2
0.1
BHEL
Neutral
136
-
33,177
28,797
34,742
-
2.8
2.3
6.9
58.9
19.6
1.0
1.0
1.3
4.8
0.8
0.6
Blue Star
Neutral
572
-
5,452
4,351
5,024
6.4
7.1
17.2
20.6
33.3
27.7
21.7
18.1
23.1
24.1
1.3
1.1
Crompton Greaves
Neutral
77
-
4,813
5,777
6,120
5.9
7.0
3.3
4.5
23.3
17.1
1.0
1.0
4.4
5.9
0.8
0.7
Greaves Cotton
Neutral
127
-
3,093
1,755
1,881
16.8
16.9
7.8
8.5
16.2
14.9
3.3
3.0
20.6
20.9
1.5
1.3
Inox Wind
Buy
214
286
4,749
5,605
6,267
15.7
16.4
24.8
30.0
8.6
7.1
2.4
1.8
25.9
24.4
0.9
0.7
KEC International
Neutral
125
-
3,205
9,294
10,186
7.9
8.1
9.9
11.9
12.6
10.5
1.8
1.6
15.6
16.3
0.6
0.5
Thermax
Neutral
889
-
10,592
5,421
5,940
7.3
7.3
25.7
30.2
34.6
29.4
4.2
3.8
12.2
13.1
1.8
1.7
VATech Wabag
Buy
554
681
3,022
3,136
3,845
8.9
9.1
26.0
35.9
21.3
15.4
2.7
2.3
13.4
15.9
0.9
0.7
Cement
ACC
Neutral
1,626
-
30,535
11,225
13,172
13.2
16.9
44.5
75.5
36.5
21.5
3.5
3.2
11.2
14.2
2.7
2.3
Ambuja Cements
Neutral
253
-
50,326
9,350
10,979
18.2
22.5
5.8
9.5
43.7
26.7
3.7
3.3
10.2
12.5
5.4
4.6
India Cements
Neutral
161
-
4,941
4,364
4,997
18.5
19.2
7.9
11.3
20.4
14.2
1.5
1.4
8.0
8.5
1.9
1.7
JK Cement
Neutral
958
-
6,696
4,398
5,173
15.5
17.5
31.2
55.5
30.7
17.3
3.7
3.2
12.0
15.5
2.1
1.7
J K Lakshmi Cement
Neutral
505
-
5,937
2,913
3,412
14.5
19.5
7.5
22.5
67.3
22.4
4.1
3.5
12.5
18.0
2.6
2.2
Orient Cement
Neutral
207
-
4,243
2,114
2,558
18.5
20.5
8.1
11.3
25.6
18.3
3.8
3.2
9.0
14.0
2.6
2.1
UltraTech Cement
Neutral
3,939
-
108,109
25,768
30,385
21.0
23.5
111.0
160.0
35.5
24.6
4.5
4.0
13.5
15.8
4.3
3.6
Construction
ITNL
Neutral
103
-
3,387
8,946
10,017
31.0
31.6
8.1
9.1
12.7
11.3
0.5
0.5
4.2
5.0
3.7
3.4
KNR Constructions
Neutral
786
-
2,211
1,385
1,673
14.7
14.0
41.2
48.5
19.1
16.2
3.6
3.1
14.9
15.2
1.7
1.4
Larsen & Toubro
Buy
1,455
1,700
135,593
67,665
77,249
10.7
11.5
57.3
71.2
25.4
20.4
2.3
2.2
12.6
14.3
2.2
1.9
Gujarat Pipavav Port
Neutral
187
-
9,026
705
788
52.2
51.7
5.0
5.6
37.3
33.3
3.7
3.3
11.2
11.2
12.5
10.7
Nagarjuna Const.
Neutral
87
-
4,814
8,842
9,775
9.1
8.8
5.3
6.4
16.3
13.5
1.3
1.2
8.2
9.1
0.7
0.6
PNC Infratech
Accumulate
127
143
3,263
2,350
2,904
13.1
13.2
9.0
8.8
14.1
14.5
0.5
0.5
15.9
13.9
1.5
1.2
Simplex Infra
Neutral
335
-
1,655
6,829
7,954
10.5
10.5
31.4
37.4
10.7
8.9
1.1
1.0
9.9
13.4
0.7
0.6
Power Mech Projects
Neutral
492
-
723
1,801
2,219
12.7
14.6
72.1
113.9
6.8
4.3
1.3
1.1
16.8
11.9
0.4
0.3
Sadbhav Engineering
Accumulate
282
298
4,836
3,598
4,140
10.3
10.6
9.0
11.9
31.3
23.7
3.3
2.9
9.9
11.9
1.6
1.4
NBCC
Neutral
264
-
15,846
7,428
9,549
7.9
8.6
8.2
11.0
32.2
24.0
1.6
1.3
28.2
28.7
1.8
1.4
MEP Infra
Neutral
42
-
679
1,877
1,943
30.6
29.8
3.0
4.2
13.9
9.9
6.7
4.5
0.6
0.6
1.7
1.6
SIPL
Neutral
107
-
3,774
1,036
1,252
65.5
66.2
(8.4)
(5.6)
4.0
4.6
(22.8)
(15.9)
11.8
9.9
Stock Watch
October 10, 2016
Company Name
Reco
CMP
Target
Mkt Cap
Sales ( Čcr )
OPM(%)
EPS (Č)
PER(x)
P/BV(x)
RoE(%)
EV/Sales(x)
(Č)
Price ( Č)
( Č cr )
FY17E
FY18E
FY17E
FY18E
FY17E
FY18E
FY17E
FY18E
FY17E
FY18E
FY17E
FY18E
FY17E
FY18E
Construction
Engineers India
Neutral
267
-
9,003
1,725
1,935
16.0
19.1
11.4
13.9
23.4
19.2
3.2
3.1
13.4
15.3
4.1
3.7
Financials
Axis Bank
Buy
533
630
127,298
46,932
53,575
3.5
3.4
32.4
44.6
16.5
12.0
2.1
1.8
13.6
16.5
-
-
Bank of Baroda
Neutral
164
-
37,765
19,980
23,178
1.8
1.8
11.5
17.3
14.3
9.5
1.6
1.3
8.3
10.1
-
-
Canara Bank
Neutral
328
-
17,832
15,225
16,836
1.8
1.8
14.5
28.0
22.7
11.7
1.6
1.3
5.8
8.5
-
-
Dewan Housing Finance Accumulate
292
325
8,532
2,225
2,688
2.9
2.9
29.7
34.6
9.9
8.5
1.6
1.4
16.1
16.8
-
-
Equitas Holdings
Buy
180
235
6,045
939
1,281
11.7
11.5
5.8
8.2
31.1
22.0
2.7
2.4
10.9
11.5
-
-
Federal Bank
Neutral
73
-
12,577
9,353
10,623
2.9
2.9
4.4
5.8
16.6
12.6
1.6
1.4
9.5
11.0
-
-
HDFC
Neutral
1,406
-
222,220
11,475
13,450
3.4
3.4
45.3
52.5
31.0
26.8
6.0
5.3
20.2
20.5
-
-
HDFC Bank
Accumulate
1,281
1,350
324,341
46,097
55,433
4.5
4.5
58.4
68.0
21.9
18.8
3.9
3.2
18.8
18.6
-
-
ICICI Bank
Neutral
251
-
145,772
39,029
45,903
3.3
3.3
16.7
16.3
15.0
15.4
1.9
1.7
10.1
12.4
-
-
LIC Housing Finance
Neutral
602
-
30,363
3,712
4,293
2.6
2.5
39.0
46.0
15.4
13.1
2.9
2.5
19.9
20.1
-
-
Punjab Natl.Bank
Neutral
143
-
30,483
23,532
23,595
2.3
2.4
6.8
12.6
21.1
11.4
3.3
2.3
3.3
6.5
-
-
RBL Bank
Accumulate
309
325
11,436
1,783
2,309
2.6
2.6
12.7
16.4
24.4
18.9
2.7
2.4
12.8
13.3
-
-
South Ind.Bank
Neutral
24
-
3,234
6,435
7,578
2.5
2.5
2.7
3.1
8.9
7.7
1.1
1.0
10.1
11.2
-
-
St Bk of India
Neutral
258
-
200,474
88,650
98,335
2.6
2.6
13.5
18.8
19.1
13.7
1.8
1.6
7.0
8.5
-
-
Union Bank
Neutral
149
-
10,246
13,450
14,925
2.3
2.3
25.5
34.5
5.9
4.3
0.9
0.7
7.5
10.2
-
-
Yes Bank
Neutral
1,275
-
53,681
8,978
11,281
3.3
3.4
74.0
90.0
17.2
14.2
3.3
2.8
17.0
17.2
-
-
FMCG
Asian Paints
Neutral
1,186
-
113,722
17,128
18,978
16.8
16.4
19.1
20.7
62.1
57.3
21.6
20.4
34.8
35.5
6.6
5.9
Britannia
Neutral
3,392
-
40,699
9,795
11,040
14.6
14.9
80.3
94.0
42.3
36.1
17.4
13.4
41.2
-
4.0
3.5
Colgate
Neutral
968
-
26,340
4,605
5,149
23.4
23.4
23.8
26.9
40.7
36.0
22.5
17.6
64.8
66.8
5.6
5.0
Dabur India
Neutral
284
-
49,960
8,315
9,405
19.8
20.7
8.1
9.2
35.1
30.9
9.8
8.1
31.6
31.0
5.7
5.0
GlaxoSmith Con*
Neutral
6,181
-
25,993
4,350
4,823
21.2
21.4
179.2
196.5
34.5
31.5
9.2
7.8
27.1
26.8
5.4
4.8
Godrej Consumer
Neutral
1,634
-
55,633
10,235
11,428
18.4
18.6
41.1
44.2
39.8
37.0
8.8
7.4
24.9
24.8
5.5
4.9
HUL
Neutral
878
-
190,097
35,252
38,495
17.6
17.4
20.4
21.9
43.0
40.1
35.4
31.0
82.2
77.3
5.2
4.8
ITC
Buy
239
283
288,673
40,059
44,439
39.0
39.2
9.1
10.1
26.3
23.7
7.2
6.3
27.2
26.5
6.7
6.0
Marico
Neutral
279
-
36,022
6,430
7,349
18.8
19.5
6.4
7.7
43.6
36.3
13.2
11.1
33.2
32.5
5.4
4.7
Nestle*
Neutral
6,719
-
64,784
10,073
11,807
20.7
21.5
124.8
154.2
53.8
43.6
22.1
19.9
34.8
36.7
6.2
5.3
Tata Global
Neutral
151
-
9,546
8,675
9,088
9.8
9.8
7.4
8.2
20.4
18.5
2.3
2.2
7.9
8.1
1.0
1.0
Procter & Gamble
Accumulate
6,991
7,369
22,694
2,939
3,342
23.2
23.0
146.2
163.7
47.8
42.7
107.1
102.7
25.3
23.5
7.3
6.3
Hygiene
Stock Watch
October 10, 2016
Company Name
Reco
CMP
Target
Mkt Cap
Sales ( Čcr )
OPM(%)
EPS (Č)
PER(x)
P/BV(x)
RoE(%)
EV/Sales(x)
(Č)
Price ( Č)
( Č cr )
FY17E FY18E
FY17E
FY18E
FY17E
FY18E
FY17E
FY18E
FY17E
FY18E
FY17E
FY18E
FY17E
FY18E
IT
HCL Tech^
Buy
806
1,000
113,679
49,242
57,168
20.5
20.5
55.7
64.1
14.5
12.6
2.9
2.3
20.3
17.9
2.2
1.8
Infosys
Buy
1,013
1,370
232,600
69,934
79,025
27.5
27.5
64.8
72.0
15.6
14.1
3.4
3.1
22.0
22.3
2.8
2.4
TCS
Buy
2,368
3,004
466,647
121,684
136,286
27.3
27.3
135.0
150.1
17.5
15.8
5.8
5.4
33.2
33.9
3.6
3.2
Tech Mahindra
Buy
419
700
40,677
30,347
33,685
17.0
17.0
37.5
41.3
11.2
10.2
2.4
2.1
21.8
20.7
1.1
0.9
Wipro
Buy
477
680
115,849
51,631
55,822
21.7
17.9
35.9
36.9
13.3
12.9
2.8
2.6
19.0
18.1
1.9
1.7
Media
D B Corp
Neutral
384
-
7,053
2,297
2,590
27.4
28.2
21.0
23.4
18.3
16.4
4.3
3.7
23.7
23.1
2.9
2.5
HT Media
Neutral
85
-
1,977
2,693
2,991
12.6
12.9
7.9
9.0
10.8
9.4
0.9
0.8
7.8
8.3
0.3
0.2
Jagran Prakashan
Accumulate
201
225
6,582
2,355
2,635
28.0
28.0
10.8
12.5
18.6
16.1
4.0
3.5
21.7
21.7
2.8
2.5
Sun TV Network
Neutral
562
-
22,157
2,850
3,265
70.1
71.0
26.2
30.4
21.5
18.5
5.5
4.9
24.3
25.6
7.4
6.3
Hindustan Media
Neutral
298
-
2,184
1,016
1,138
24.3
25.2
27.3
30.1
10.9
9.9
2.1
1.9
16.2
15.8
1.5
1.3
Ventures
TV Today Network
Accumulate
338
363
2,015
637
743
27.5
27.5
18.4
21.4
18.4
15.8
3.2
2.7
17.4
17.2
2.8
2.3
Metals & Mining
Coal India
Neutral
319
-
201,587
84,638
94,297
21.4
22.3
24.5
27.1
13.0
11.8
5.4
5.2
42.6
46.0
1.9
1.7
Hind. Zinc
Neutral
252
-
106,415
14,252
18,465
55.9
48.3
15.8
21.5
15.9
11.7
2.6
2.3
17.0
20.7
7.5
5.8
Hindalco
Neutral
158
-
32,637
107,899
112,095
7.4
8.2
9.2
13.0
17.2
12.2
0.8
0.8
4.8
6.6
0.8
0.8
JSW Steel
Neutral
1,775
-
42,897
53,201
58,779
16.1
16.2
130.6
153.7
13.6
11.6
1.8
1.6
14.0
14.4
1.6
1.4
NMDC
Neutral
117
-
46,566
6,643
7,284
44.4
47.7
7.1
7.7
16.5
15.3
1.4
1.4
8.8
9.2
4.8
4.3
SAIL
Neutral
50
-
20,630
47,528
53,738
(0.7)
2.1
(1.9)
2.6
19.2
0.5
0.5
(1.6)
3.9
1.3
1.2
Vedanta
Neutral
195
-
57,767
71,744
81,944
19.2
21.7
13.4
20.1
14.5
9.7
1.2
1.1
8.4
11.3
1.2
0.9
Tata Steel
Neutral
406
-
39,470
121,374
121,856
7.2
8.4
18.6
34.3
21.9
11.9
1.4
1.3
6.1
10.1
1.0
0.9
Oil & Gas
Cairn India
Neutral
223
-
41,847
9,127
10,632
4.3
20.6
8.8
11.7
25.4
19.1
0.8
0.8
3.3
4.2
6.0
5.0
GAIL
Neutral
414
-
52,540
56,220
65,198
9.3
10.1
27.1
33.3
15.3
12.4
1.4
1.3
9.3
10.7
1.1
0.9
ONGC
Neutral
268
-
229,030
137,222
152,563
15.0
21.8
19.5
24.1
13.7
11.1
1.2
1.1
8.5
10.1
2.0
1.7
Indian Oil Corp
Neutral
641
-
155,608
373,359
428,656
5.9
5.5
54.0
59.3
11.9
10.8
1.8
1.7
16.0
15.6
0.6
0.5
Reliance Industries
Neutral
1,110
-
359,895
301,963
358,039
12.1
12.6
87.7
101.7
12.7
10.9
1.3
1.2
10.7
11.3
1.7
1.4
Pharmaceuticals
Alembic Pharma
Neutral
673
-
12,691
3,483
4,083
20.2
21.4
24.3
30.4
27.7
22.1
6.3
5.0
25.5
25.3
3.6
3.0
Aurobindo Pharma
Neutral
856
-
50,079
15,720
18,078
23.7
23.7
41.4
47.3
20.7
18.1
5.4
4.2
29.6
26.1
3.4
3.0
Aventis*
Neutral
4,146
-
9,548
2,357
2,692
17.3
17.3
153.5
169.2
27.0
24.5
4.6
3.7
25.8
28.4
3.7
3.0
Cadila Healthcare
Neutral
389
-
39,839
11,126
13,148
22.0
22.0
17.1
20.0
22.8
19.5
5.8
4.6
28.8
26.6
3.6
2.9
Cipla
Reduce
570
490
45,779
15,378
18,089
17.4
18.4
21.6
27.2
26.4
20.9
3.4
3.0
13.7
15.2
3.2
2.7
Stock Watch
October 10, 2016
Company Name
Reco
CMP
Target
Mkt Cap
Sales ( Čcr )
OPM(%)
EPS (Č)
PER(x)
P/BV(x)
RoE(%)
EV/Sales(x)
(Č)
Price ( Č)
( Č cr )
FY17E FY18E
FY17E
FY18E
FY17E
FY18E
FY17E
FY18E
FY17E
FY18E
FY17E
FY18E
FY17E
FY18E
Pharmaceuticals
Dr Reddy's
Neutral
3,054
-
50,610
16,043
18,119
23.1
24.7
126.0
157.8
24.2
19.4
3.6
3.1
15.7
17.1
3.1
2.7
Dishman Pharma
Sell
240
45
3,870
1,718
1,890
22.7
22.8
9.5
11.3
25.2
21.2
2.4
2.2
10.1
10.9
2.7
2.4
GSK Pharma*
Neutral
2,915
-
24,690
3,528
3,811
16.6
18.8
51.8
59.4
56.3
49.1
15.1
15.0
26.3
30.6
6.8
6.3
Indoco Remedies
Sell
314
225
2,894
1,112
1,289
18.2
18.2
13.2
15.6
23.8
20.1
4.2
3.6
19.2
19.2
2.7
2.3
Ipca labs
Neutral
606
-
7,649
3,303
3,799
15.3
15.3
17.3
19.7
35.0
30.8
3.1
2.8
9.1
9.4
2.4
2.1
Lupin
Buy
1,499
1,809
67,570
15,912
18,644
26.4
26.7
58.1
69.3
25.8
21.6
5.0
4.1
21.4
20.9
4.3
3.6
Sun Pharma
Buy
751
944
180,791
31,129
35,258
30.0
30.9
28.0
32.8
26.8
22.9
4.1
3.4
18.7
18.9
5.4
4.6
Power
Tata Power
Neutral
81
-
21,826
36,916
39,557
17.4
27.1
5.1
6.3
15.8
12.8
1.4
1.3
9.0
10.3
1.6
1.4
NTPC
Neutral
148
-
122,321
86,605
95,545
17.5
20.8
11.8
13.4
12.6
11.1
1.3
1.2
10.5
11.1
2.8
2.8
Power Grid
Neutral
177
-
92,599
25,763
29,762
74.3
73.1
14.8
17.3
12.0
10.2
1.9
1.6
16.9
17.5
7.9
7.5
Real Estate
Prestige Estate
Neutral
211
-
7,901
4,707
5,105
25.2
26.0
10.3
13.0
20.5
16.2
1.6
1.5
10.3
10.2
2.8
2.5
MLIFE
Buy
442
522
1,812
1,152
1,300
22.7
24.6
29.9
35.8
14.8
12.3
1.1
1.0
7.6
8.6
2.3
1.9
Telecom
Bharti Airtel
Neutral
320
-
127,977
105,086
114,808
34.5
34.7
12.2
16.4
26.2
19.5
1.8
1.7
6.8
8.4
2.1
1.9
Idea Cellular
Neutral
80
-
28,788
40,133
43,731
37.2
37.1
6.4
6.5
12.5
12.3
1.0
1.0
8.2
7.6
1.7
1.5
zOthers
Abbott India
Neutral
4,798
-
10,195
3,153
3,583
14.1
14.4
152.2
182.7
31.5
26.3
154.8
132.2
25.6
26.1
2.9
2.5
Bajaj Electricals
Buy
263
306
2,655
5,099
5,805
5.6
5.9
11.4
14.6
23.1
18.0
3.1
2.7
13.4
15.1
0.5
0.5
Finolex Cables
Neutral
439
-
6,709
2,883
3,115
12.0
12.1
14.2
18.6
30.9
23.6
16.4
14.4
15.8
14.6
2.0
1.8
Goodyear India*
Neutral
846
-
1,951
1,598
1,704
10.4
10.2
49.4
52.6
17.1
16.1
79.1
69.3
18.2
17.0
0.9
128.6
Hitachi
Neutral
1,585
-
4,311
2,081
2,433
8.8
8.9
33.4
39.9
47.5
39.7
38.3
31.9
22.1
21.4
2.1
1.8
Jyothy Laboratories
Neutral
370
-
6,710
1,440
2,052
11.5
13.0
8.5
10.0
43.5
37.0
10.5
9.8
18.6
19.3
4.9
3.4
Page Industries
Neutral
15,395
-
17,171
2,450
3,124
20.1
17.6
299.0
310.0
51.5
49.7
342.9
261.7
47.1
87.5
7.1
5.6
Relaxo Footwears
Neutral
446
-
5,357
2,085
2,469
9.2
8.2
7.6
8.0
59.0
56.2
22.9
19.5
17.9
18.8
2.7
2.3
Siyaram Silk Mills
Neutral
1,481
-
1,388
1,799
2,040
11.6
11.7
104.9
122.4
14.1
12.1
2.3
2.0
16.4
16.4
1.0
0.9
Styrolution ABS India*
Neutral
616
-
1,083
1,440
1,537
9.2
9.0
40.6
42.6
15.2
14.5
38.7
35.2
12.3
11.6
0.7
0.6
TVS Srichakra
Neutral
3,857
-
2,953
2,304
2,614
13.7
13.8
231.1
266.6
16.7
14.5
433.3
341.2
33.9
29.3
1.3
1.1
HSIL
Neutral
343
-
2,479
2,384
2,515
15.8
16.3
15.3
19.4
22.4
17.7
22.3
19.2
7.8
9.3
1.2
1.1
Kirloskar Engines India
Neutral
356
-
5,150
2,554
2,800
9.9
10.0
10.5
12.1
33.9
29.4
14.2
13.4
10.7
11.7
1.7
1.5
Ltd
M M Forgings
Neutral
454
-
547
546
608
20.4
20.7
41.3
48.7
11.0
9.3
62.1
55.0
16.6
17.0
0.9
0.8
Banco Products (India)
Neutral
215
-
1,540
1,353
1,471
12.3
12.4
14.5
16.3
14.9
13.2
20.5
18.5
14.5
14.6
1.1
115.8
Stock Watch
October 10, 2016
Company Name
Reco
CMP
Target
Mkt Cap
Sales ( Čcr )
OPM(%)
EPS (Č)
PER(x)
P/BV(x)
RoE(%)
EV/Sales(x)
(Č)
Price ( Č)
( Č cr )
FY17E
FY18E
FY17E
FY18E
FY17E
FY18E
FY17E
FY18E
FY17E
FY18E
FY17E
FY18E
FY17E
FY18E
zOthers
Competent Automobiles Neutral
192
-
118
1,137
1,256
3.1
2.7
28.0
23.6
6.9
8.1
36.9
33.4
14.3
11.5
0.1
0.1
Nilkamal
Neutral
1,305
-
1,948
1,995
2,165
10.7
10.4
69.8
80.6
18.7
16.2
74.6
64.8
16.6
16.5
1.0
0.9
Visaka Industries
Neutral
195
-
310
1,051
1,138
10.3
10.4
21.0
23.1
9.3
8.4
25.0
23.4
9.0
9.2
0.6
0.5
Transport Corporation of
Neutral
186
-
1,426
2,671
2,911
8.5
8.8
13.9
15.7
13.4
11.9
1.8
1.6
13.7
13.8
0.6
0.6
India
Elecon Engineering
Neutral
62
-
679
1,482
1,660
13.7
14.5
3.9
5.8
16.0
10.7
3.8
3.5
7.8
10.9
0.8
0.7
Surya Roshni
Neutral
224
-
980
3,342
3,625
7.8
7.5
17.3
19.8
12.9
11.3
24.6
19.7
10.5
10.8
0.6
0.5
MT Educare
Neutral
143
-
567
366
417
17.7
18.2
9.4
10.8
15.2
13.2
3.4
2.9
22.2
22.3
1.5
1.3
Radico Khaitan
Neutral
137
-
1,818
1,659
1,802
13.0
13.2
6.3
7.4
21.6
18.5
1.9
1.7
8.6
9.3
1.5
1.4
Garware Wall Ropes
Neutral
544
-
1,190
873
938
12.9
13.1
30.9
34.9
17.6
15.6
2.8
2.4
15.7
15.2
1.3
1.2
Wonderla Holidays
Neutral
399
-
2,257
287
355
38.0
40.0
11.3
14.2
35.4
28.1
5.1
4.4
21.4
23.9
7.5
6.1
Linc Pen & Plastics
Neutral
268
-
396
382
420
9.3
9.5
13.5
15.7
19.9
17.1
3.4
2.9
17.1
17.3
1.1
1.0
The Byke Hospitality
Neutral
187
-
751
287
384
20.5
20.5
7.6
10.7
24.7
17.5
5.2
4.2
20.7
23.5
2.6
2.0
Interglobe Aviation
Neutral
950
-
34,230
21,122
26,005
14.5
27.6
110.7
132.1
8.6
7.2
51.4
36.7
168.5
201.1
1.6
1.2
Coffee Day Enterprises
Neutral
226
-
4,650
2,964
3,260
20.5
21.2
4.7
8.0
-
28.2
2.6
2.4
5.5
8.5
2.0
1.8
Ltd
Navneet Education
Neutral
100
-
2,393
1,062
1,147
24.0
24.0
6.1
6.6
16.5
15.2
3.4
3.0
20.6
19.8
2.3
2.2
Navkar Corporation
Buy
196
265
2,790
408
612
42.9
42.3
6.8
11.5
28.9
17.0
2.0
1.8
6.9
10.5
7.7
5.2
UFO Moviez
Neutral
458
-
1,264
619
685
33.2
33.4
30.0
34.9
15.3
13.1
2.1
1.8
13.8
13.9
1.8
1.4
VRL Logistics
Neutral
312
-
2,846
1,902
2,119
16.7
16.6
14.6
16.8
21.4
18.5
4.7
4.1
21.9
22.2
1.6
1.4
Team Lease Serv.
Neutral
1,074
-
1,836
3,229
4,001
1.5
1.8
22.8
32.8
47.2
32.7
5.1
4.4
10.7
13.4
0.5
0.4
S H Kelkar & Co.
Neutral
296
-
4,287
1,036
1,160
15.1
15.0
6.1
7.2
48.5
41.3
5.2
4.8
10.7
11.5
4.0
3.5
Quick Heal
Neutral
238
-
1,668
408
495
27.3
27.0
7.7
8.8
30.8
27.1
2.9
2.9
9.3
10.6
3.2
2.7
Narayana Hrudaya
Neutral
336
-
6,857
1,873
2,166
11.5
11.7
2.6
4.0
126.9
84.6
7.8
7.0
6.1
8.3
3.8
3.2
Manpasand Bever.
Neutral
735
-
3,678
836
1,087
19.6
19.4
16.9
23.8
43.5
30.9
5.2
4.6
12.0
14.8
4.1
3.1
Parag Milk Foods
Neutral
306
-
2,572
1,919
2,231
9.3
9.6
9.5
12.9
32.4
23.6
5.0
4.1
15.5
17.5
1.5
1.3
Mirza International
Buy
97
113
1,169
1,024
1,148
18.0
18.0
6.9
8.0
14.1
12.1
2.4
2.0
16.6
16.2
1.3
1.2
Source: Company, Angel Research; Note: *December year end; #September year end; &October year end; Price as on October 07, 2016
Market Outlook
October 10, 2016
Research Team Tel: 022 - 39357800
DISCLAIMER
Angel Broking Private Limited (hereinafter referred to as “Angel”) is a registered Member of National Stock Exchange of India
Limited,Bombay Stock Exchange Limited and Metropolitan Stock Exchange Limited. It is also registered as a Depository Participant with
CDSL and Portfolio Manager with SEBI. It also has registration with AMFI as a Mutual Fund Distributor. Angel Broking Private Limited is a
registered entity with SEBI for Research Analyst in terms of SEBI (Research Analyst) Regulations, 2014 vide registration number
INH000000164. Angel or its associates has not been debarred/ suspended by SEBI or any other regulatory authority for accessing
/dealing in securities Market. Angel or its associates/analyst has not received any compensation / managed or
co-managed public offering of securities of the company covered by Analyst during the past twelve months.
This document is solely for the personal information of the recipient, and must not be singularly used as the basis of any investment
decision. Nothing in this document should be construed as investment or financial advice. Each recipient of this document should make
such investigations as they deem necessary to arrive at an independent evaluation of an investment in the securities of the companies
referred to in this document (including the merits and risks involved), and should consult their own advisors to determine the merits and
risks of such an investment.
Reports based on technical and derivative analysis center on studying charts of a stock's price movement, outstanding positions and
trading volume, as opposed to focusing on a company's fundamentals and, as such, may not match with a report on a company's
fundamentals. Investors are advised to refer the Fundamental and Technical Research Reports available on our website to evaluate the
contrary view, if any.
The information in this document has been printed on the basis of publicly available information, internal data and other reliable
sources believed to be true, but we do not represent that it is accurate or complete and it should not be relied on as such, as this
document is for general guidance only. Angel Broking Pvt. Limited or any of its affiliates/ group companies shall not be in any way
responsible for any loss or damage that may arise to any person from any inadvertent error in the information contained in this report.
Angel Broking Pvt. Limited has not independently verified all the information contained within this document. Accordingly, we cannot
testify, nor make any representation or warranty, express or implied, to the accuracy, contents or data contained within this document.
While Angel Broking Pvt. Limited endeavors to update on a reasonable basis the information discussed in this material, there may be
regulatory, compliance, or other reasons that prevent us from doing so.
This document is being supplied to you solely for your information, and its contents, information or data may not be reproduced,
redistributed or passed on, directly or indirectly.
Neither Angel Broking Pvt. Limited, nor its directors, employees or affiliates shall be liable for any loss or damage that may arise from
or in connection with the use of this information.